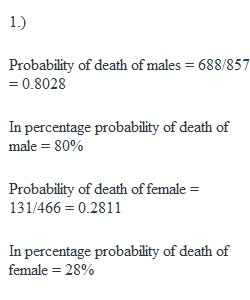
Q Evaluate Being able to draw probability conclusions from data is important. This data has a great deal of information. For example, on the table titled “By Economic Status and Sex,” looking at the total male population exposed to risk, there were 857 males. Looking at the same table, 688 of those males died. The proportion of males exposed to risk that died is 688/857=0.80. Thus, among the males exposed to risk, there are 80 deaths per 100. By the end of this discussion, you will have demonstrated your ability to: • Analyze and interpret data • Calculate probabilities given raw data By Economic Status and Sex Economic Status Population Exposed to Risk Number of Deaths Deaths per 100 Exposed to Risk Male Female Both Male Female Both Male Female Both I (high) II III (low) Unknown 172 172 504 9 132 103 208 23 304 275 712 32 111 150 419 8 6 13 107 5 117 163 526 13 65 87 83 89 5 13 51 22 39 59 74 41 Total 857 466 1323 688 131 819 80 28 62 By Economic Status and Age Economic Status Population Exposed to Risk Number of Deaths Deaths per 100 Exposed to Risk Adult Child Both Adult Child Both Adult Child Both I and II III (low) Unknown 560 645 32 19 67 0 579 712 32 280 477 13 0 49 0 280 526 13 50 74 41 0 73 - 48 74 41 Total 1237 86 1323 770 49 819 62 57 62 ________________________________________ Refer to the data tables above and answer the following questions. Be sure to support your answers (e.g. provide probabilities, ratios, etc.). 1. Is there a difference in the probability of death for males vs. females? 2. Does age make a difference in the probability of death? 3. What does the number of children in relation to the number of adults tell you about this population? 4. Does economic status make a difference in the probability of death? Does your answer to this question differ depending on the subgroup you are looking at? 5. What other questions would you like to ask about these data or this event in order to help you make a determination? Can you guess what event generated this data? We seek well-reasoned hypotheses about the cause of the event based on the given data. With this in mind, please do not search the internet looking for the answer. Incorrect guesses based on sound, logical thinking will be graded favorably. To complete this discussion: Post a thorough response to each question listed above. Be sure to read your peers’ posts and respond to them, as well. To gain full credit for your work, you must post one substantive response and reply to a minimum of two other postings. I would also like you to respond to anyone who comments on your post. Your initial post is due by Thursday at 11:59 PM ET. Your responses are due by Sunday at 11:59 PM ET. Consult the Discussion Posting Guide for information about writing your discussion posts. It is recommended that you write your post in a document first. Check your work and correct any spelling or grammatical errors. When you are ready to make your initial post, click on "Reply." Then copy/paste the text into the message field, and click “Post Reply.” This is a “post first” discussion forum. You must submit your initial post before you can view other students’ posts. To respond to a peer, click “Reply” beneath her or his post and continue as with an initial post. ________________________________________ Evaluation This discussion will be graded using the discussion board rubric. Please review this rubric, located on the Rubrics page within the Course Introduction module of the course, prior to beginning your work to ensure your participation meets the criteria in place for this discussion. All discussions combined are worth 20% of your final course grade.
View Related Questions